Melbourne Auction Results 21st September 2015
In this week’s property market wrap we look at the latest REIV data and find out which regional suburb in Victoria was the strongest performer. We also share a report via Cameron Kusher of CoreLogic RP Data who explains the RBA’s analysis of inner city housing prices relative to those in the outer ring.
Clearance Rate: 76%
Reported Auctions: 944
Sold at Auction: 581
Passed in: 228
Sold Before: 133
Sold After: 2
Auction Volumes: $678.37m
Last Weekend: 1080
Last Year: 59
Houses: 78%
Units: 70%
A clearance rate of 76 per cent was recorded this weekend compared to 75 per cent last weekend and 72 per cent this weekend last year. There were 944 auctions reported to the REIV this weekend, with 716 selling and 228 being passed in, 108 of those on a vendor bid.
An estimated $18 billion worth of property has changed hands in the year to date via auctions – this is up 29 per cent from this time last year which is the highest figure on record.
$18 Billion Worth Of Property Has Changed Hands
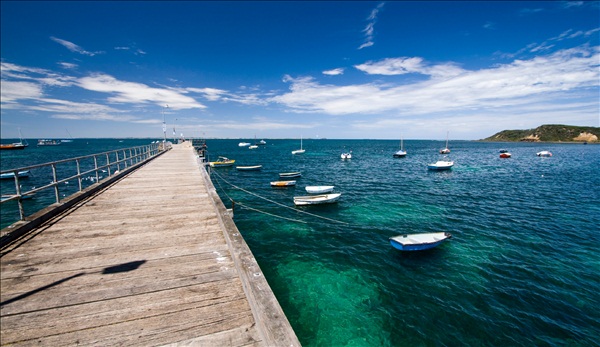
Photo Source: visitmorningtonpeninsula.org
Days On Market Fall In Regional Victoria
There are a number of market indicators which chart the statewide and local performance of the property sector. This includes the average length of time that homes in each town or city take to sell, known as median days on market.
The latest REIV data shows a number of regional towns across Victoria recorded significant falls in the median days on market over the year, reflecting the strength of the property market in these areas. Find out which regional suburb in Victoria’s was the strongest performer in this report from REIV.
Housing More Expensive In The Inner City But Not Necessarily Seeing Stronger Growth
The Reserve Bank’s (RBA) Head of Financial Stability Luci Ellis gave an interesting speech entitled ‘Property Markets and Financial Stability: What We Know So Far’. Cameron Kusher of CoreLogic RP Date looks at one of the more interesting pieces of analysis in the speech being, the analysis of inner city housing prices relative to those in the outer ring.
The chart below was the analysis showed in the speech.
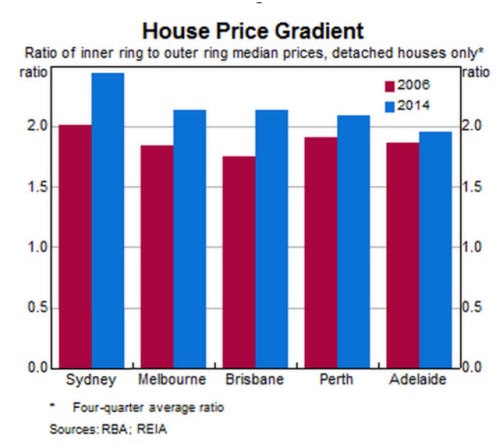
Source: corelogic.com.au
Top 5 Houses
1. 27-29 Kintore Street, Camberwell $7,700,000
2. 15 Cole Street, Brighton $4,425,000
3. 33 Avenue Athol, Canterbury $4,360,000
4. 33 Service Street, Hampton $3,900,000
5. 16 Orchard Street, Brighton $3,761,000
Top 5 Bargain Houses
1. 678 High Street, Melton West $308,000
2. 22 Bennett Street, Bittern $315,000
3. 3 Kilmore Crescent, Dallas $330,000
4. 4 Darnley Drive, Skye $331,000
5. 20 Nigra Street, Doveton $339,500
Top 5 Apartments
1. 1/82 Vale Street, East Melbourne $2,365,000
2. 1 Princes Place, Port Melbourne $1,805,000
3. 86A Halifax Street, Brighton $1,650,000
4. 4/27-29 Hodgson Street, Brunswick $1,620,000
5. 3 Queen Street, South Melbourne $1,525,000
Top 5 Bargain Apartments
1. 1/3 Manfred Avenue, St Albans $155,000
2. 6/20 Highland Street, Kingsbury $240,000
3. 8/14 Alma Road, St Kilda $278,000
4. 5/50 Lillimur Road, Ormond $287,500
5. 4/21 Richardson Street, Essendon $300,000
Source: REIV


